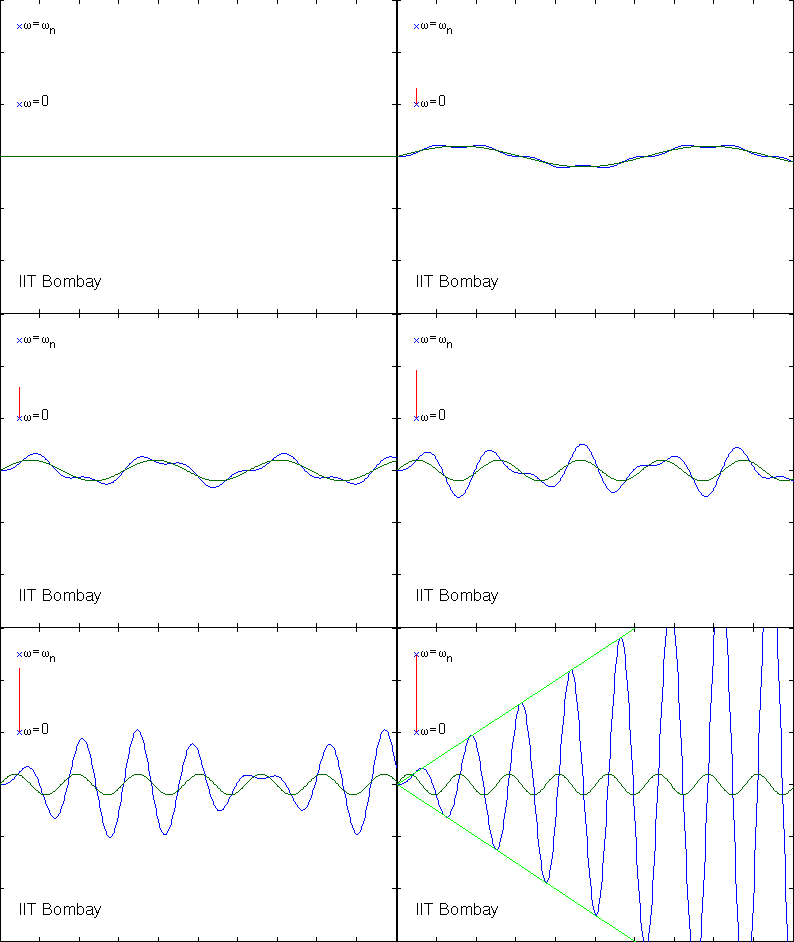
The animated plot on the right shows how the response of
an
undamped second-order oscillator to a sinusoidal forcing function
changes as the frequency of the input sinusoid changes. Each frame of
the plot shows the response (in blue) as a function of time on the
x axis for a value of input
frequency that lies between zero and the natural frequency

of
the oscillator. The green curve depicts the forcing function itself.
The vertical red line depicts the forcing frequency as it increases
from 0 to

.
Notice that for small values of the forcing frequency, the blue
response almost coincides with the green forcing function, that is, the
oscillator moves in synchronization with the forcing. This is because
the inertia force is small at low frequencies, and the oscillator
behaves as if it were only a spring (of unit stiffness for the numbers
that were chosen to create the plot). As the forcing frequency
increases, the inertia force becomes comparable to the stiffness force,
and the response begins to deviate from the forcing function. The
response at any frequency is the superposition of two harmonic
oscillations, one at the forcing frequency

and the other at the natural frequency

.
As

approaches

,
the response assumes the form of a high frequency oscillation whose
amplitude increases and decreases sinusoidally at a relatively lower
frequency, and thus exhibits the phenomenon of
beats. The last frame of the plot
depicts what happens when the forcing frequency equals the natural
frequency. The response is an oscillation whose amplitude grows
linearly with time, as indicated by the linear envelope formed by the
two straight green lines. This unbounded response is an illustration of
the phenomenon of
resonance.

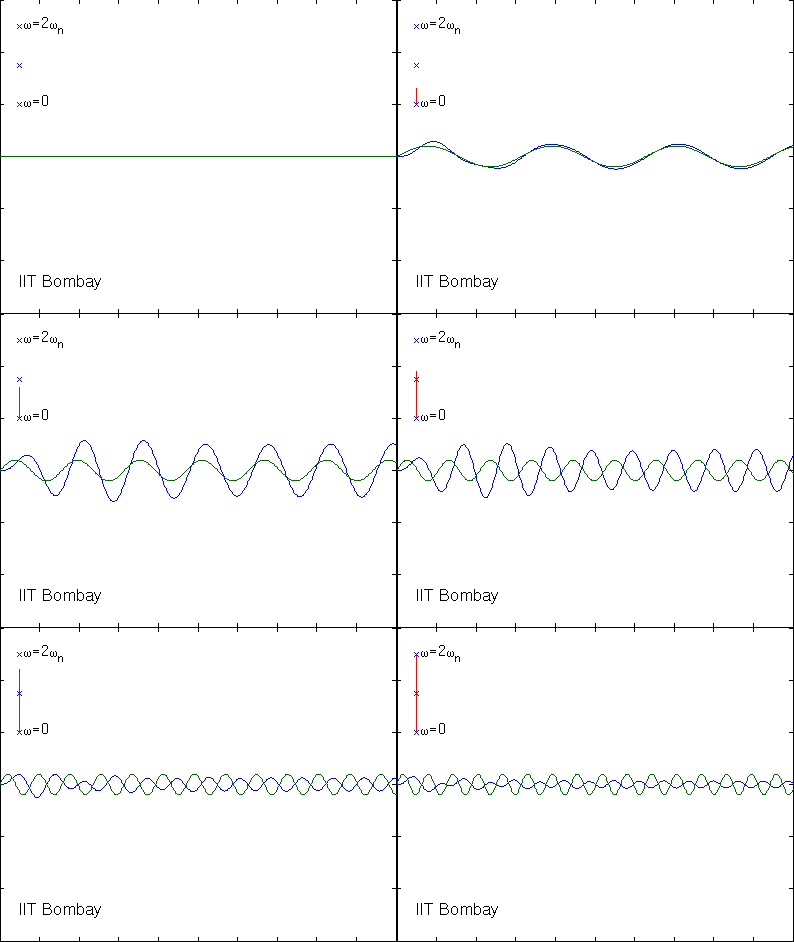
The animated plot on the left shows the response
of a damped second-order oscillator with damping ratio 0.1 to a
sinusoidal forcing as the forcing frequency increases from zero to
twice the undamped natural frequency

.
Notice once again, that at low forcing frequencies, the response
follows the forcing input very closely, since the inertia and damping
forces are weak at low frequencies, and the system essentially behaves
like a spring. As in the undamped case, the response is a superposition
of a natural response of the system and a forced response. While the
forced response is sinusoidal and has the same frequency as the forcing
frequency, the natural response in the presence of damping is
sinusoidal with an exponentially decaying envelope. Consequently, the
natural response is
transient
and dies out after a few cycles leaving only the forced response in the
steady state. The first few cycles of the forcing function in the plot
clearly show the transient response, while subsequent cycles show the
steady state response. Notice that the steady state response has the
same frequency as the forcing function, but differs from the forcing
function in amplitude and phase. The plot shows that the steady state
response lags the forcing function at all frequencies, and the amount
of lag increases with the frequency. On the other hand, the steady
state amplitude of achieves a maximum somewhere near resonance, and
then steadily decreases as the forcing frequency increases. However,
unlike in the undamped case, the response is bounded at all input
frequencies. To see how the steady state amplification and phase shift
of a second-order system vary with forcing frequency and damping ratio,
see
frequency response of second-order systems.

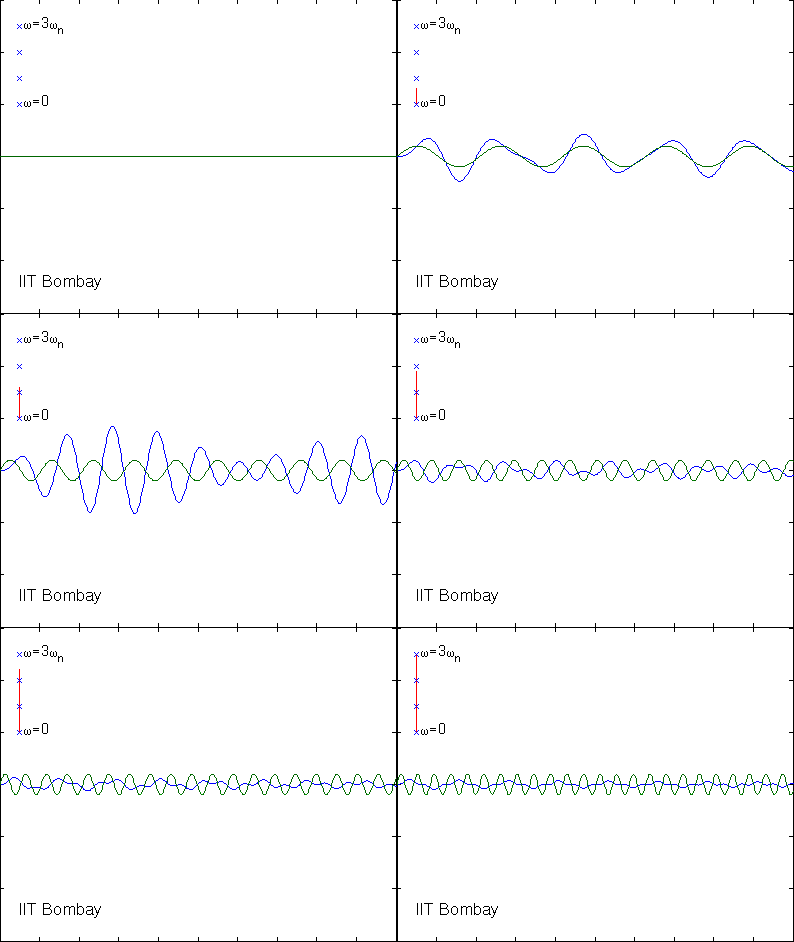
The animated plot on the right shows the harmonic
response of a lightly damped second-order oscillator having a damping
ratio of only 0.02. Qualitatively, the harmonic response of a lightly
damped oscillator is not different from that of a moderately damped
oscillator such as the one discussed above. However, because of the low
damping, the transient response takes a long time to decay. You will
notice that the steady state response cannot be seen throughout
the time and frequency range shown on the plot, indicating that
the time scales chosen are not long enough for the transient response
to die out. You will also notice the beating phenomenon as well as a
large increase in the response amplitude near resonance.
 The animated plot on the right shows how the response of
an
undamped second-order oscillator to a sinusoidal forcing function
changes as the frequency of the input sinusoid changes. Each frame of
the plot shows the response (in blue) as a function of time on the x axis for a value of input
frequency that lies between zero and the natural frequency
  The animated plot on the left shows the response
of a damped second-order oscillator with damping ratio 0.1 to a
sinusoidal forcing as the forcing frequency increases from zero to
twice the undamped natural frequency
  The animated plot on the right shows the harmonic
response of a lightly damped second-order oscillator having a damping
ratio of only 0.02. Qualitatively, the harmonic response of a lightly
damped oscillator is not different from that of a moderately damped
oscillator such as the one discussed above. However, because of the low
damping, the transient response takes a long time to decay. You will
notice that the steady state response cannot be seen throughout
the time and frequency range shown on the plot, indicating that
the time scales chosen are not long enough for the transient response
to die out. You will also notice the beating phenomenon as well as a
large increase in the response amplitude near resonance.