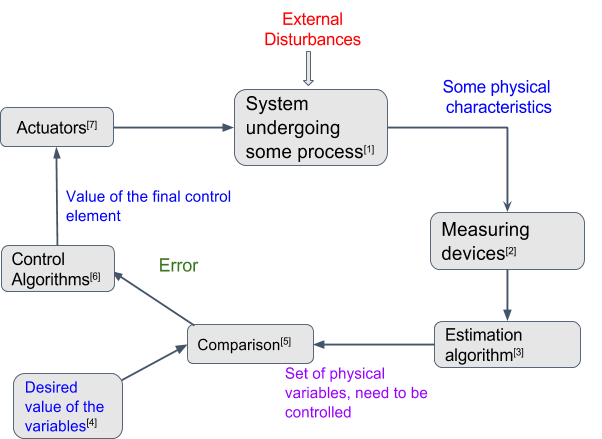
Flow Chart of a Control System
A control loop for a controller controlling a physical system can be summarised as follows:
The following are the representations of the blocks in the above flow chart:
- The system to be controlled which is interacting with the surroundings
- The sensors output the current parameters of system
- An estimation algorithm used to define the current state of the system by interpreting the data provided by the sensors
- Represents the desired state of the system. This is the requirement and the aim set for the control algorithm. It is pre-defined for the system by the user of the system.
- This block outputs the error value ie difference between the estimated current state of the system and the desired state
- The control algorithm, used to correct the system(control), processes the error value calculated and outputs the required input for the actuators to correct the system.
- Actuators - These are devices used to produce a restoring force to bring the system back to the desired state in case it is deviated. These output the restoring force.
This restoring force is coupled with the disturbing forces from the external surroundings. This modifies the current position of the system to new coordinates and the flow continues to try to bring the system to the desired equilibrium.
Almost all the systems and controllers can expressed in the form of above flowchart
If you are done reading this page, you can go back to Attitude Determination and Control Subsystem.
